
After a few very intense months, we have completed the last proof of concept at the Port of Las Palmas. This closes the Carbon Wave Gauge (CWG) project, developed together with VTI (Vázquez y Torres Ingeniería) and funded by the Ports 4.0 fund of Puertos del Estado, in whose 2nd Call it was selected at the end of 2023.
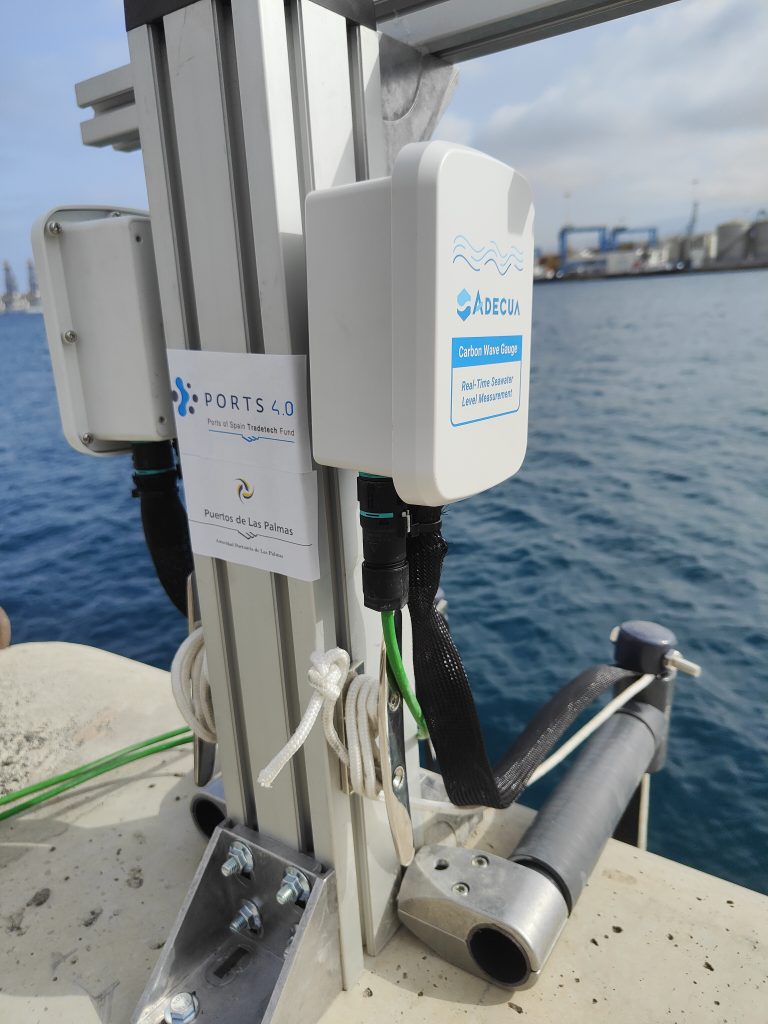
What is the Carbon Wave Gauge
The CWG is a portable instrument that measures waves and sea level in real time, based on a new measuring principle. We designed it to be easy to transport and install: it is mounted on a frame fixed to the quay and, once a measurement campaign is over, it can be taken down and moved to another port.
Three ports with very different conditions
Over the last few weeks we have installed and validated the sensors in three ports chosen precisely because they are so different:
- Port of Tarifa, with a large tidal range and exposed to waves from the Strait of Gibraltar.
- Port of Barcelona, where the Mediterranean tide barely moves the water level. It was the ideal place to test the sensor’s sensitivity.
- Port of Las Palmas, with Atlantic conditions, to complete the validation in a third oceanographic environment.
Results against the REDMAR network
To assess the instrument, we compared its measurements with official data from the tide gauges of Puertos del Estado’s REDMAR network. The chart shows, as an example, part of that comparison in Tarifa and Barcelona.
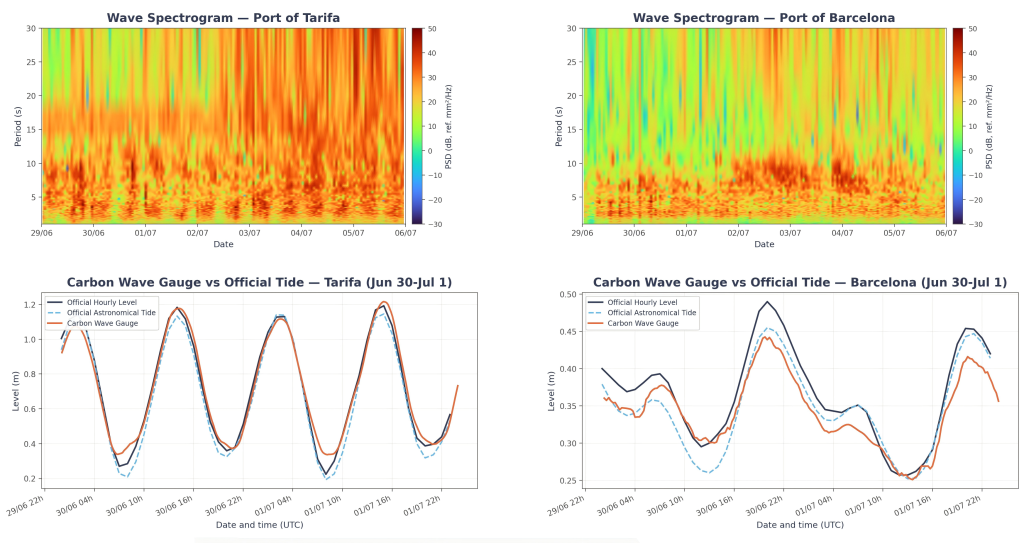
In Tarifa, with a tide of almost one metre, the CWG curve practically matches the official tide gauge in every cycle, in both amplitude and phase.
In Barcelona the tide is around 20 cm and, on top of that, the real level departs from the predicted astronomical tide. The CWG follows the level measured by REDMAR rather than the prediction, which confirms that it records what is really happening in the port.
The spectrograms at the top show how wave energy is distributed by period over the week, calculated from the instrument’s own data.
Sensor, acquisition and software
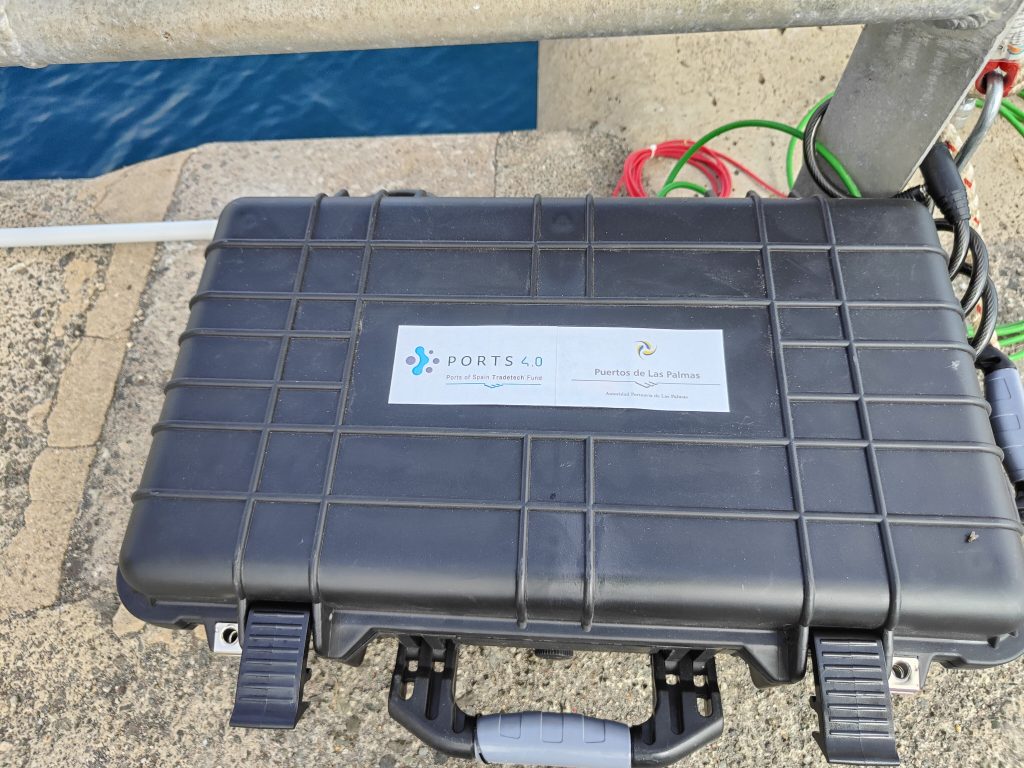
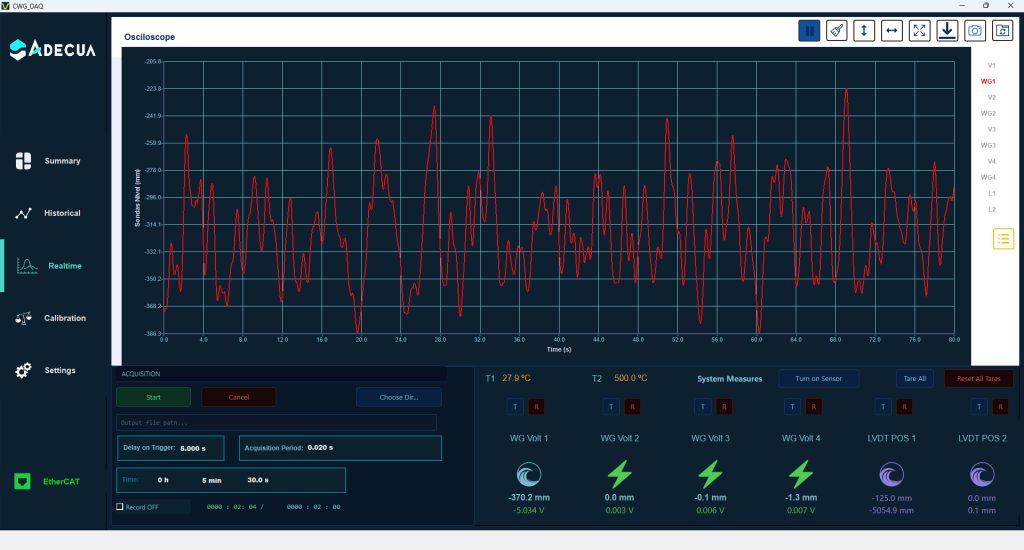
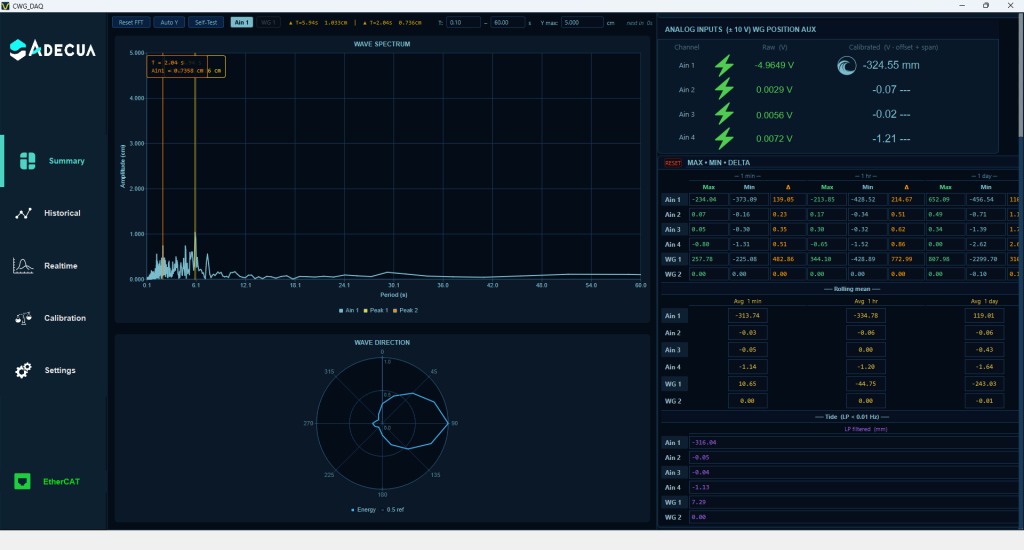
The acquisition electronics sit in a rugged case placed next to the sensor. Measurements are managed with software developed for the project, which shows the wave spectrum and direction in real time, stores the measurement history and includes a calibration section.
Acknowledgements
We would like to thank the Port Authority of the Bay of Algeciras, the Port Authority of Barcelona and the Port Authority of Las Palmas for allowing us to work at their facilities and for making the tests as easy as possible. And thanks to everyone at the ports who helped us complete them successfully.
Let’s talk
Do you need to measure waves or sea level?
If you would like more information about the Carbon Wave Gauge, or you have a measurement project in a port, a lab or at sea, tell us what you need.